What is the Random Walk Theory?
The random walk theory suggests that changes in stock prices have the same distribution and are independent of each other, therefore, the past movement or trend of a stock price or market cannot be used to predict its future movement. In short, this is the idea that stocks take a random and unpredictable path.
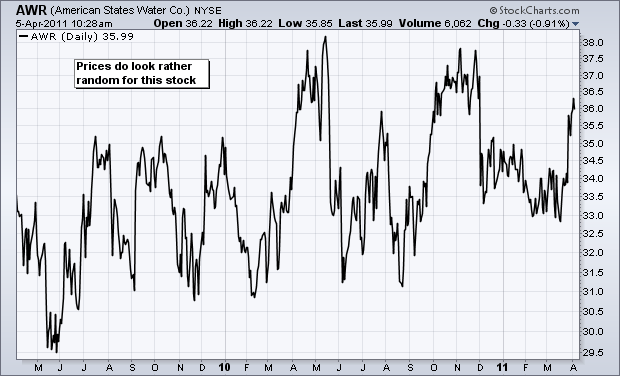
But is it really Random? or it has some predefined Path?
I studied the P/Sales ratio and the annualized return of S&P 500 and some individual stock and to my amusement, I found that in the long run i.e. 10 years, P/Sales is a strong predictor for the return of stock of interest.
Which means that the stock market as a whole is not “efficient” and does not follow a purely a purely “random walk” in long term. t is possible to estimate the future long-term return of the stock-market and some individual stocks from just a single indicator variable.
In this work, I will primarily use the P/Sales ratio as the predictor variable instead, because the historical P/Sales ratio may be easier to obtain for some companies, and because the P/Book ratio is more sensitive to changes in capitalization structure for individual companies.
I am considering S&P500 stocks, just because I already had the data stored in my system.
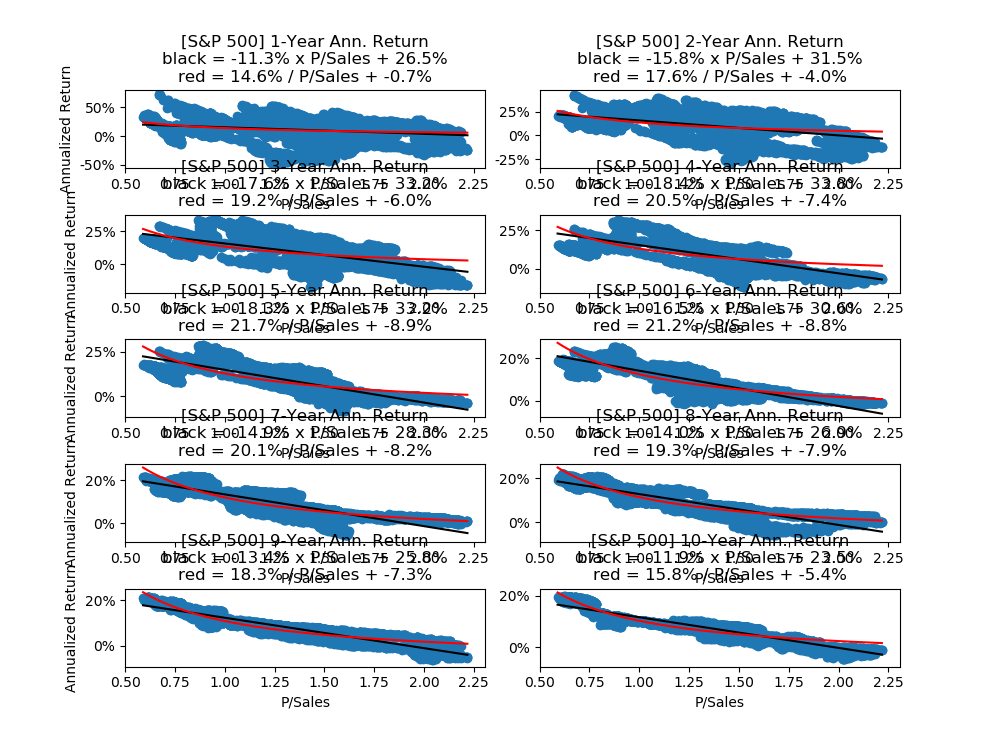
*sorry for the glitches, Anyways it’s serving it’s purpose!
As we can see above the P/S ratio is a weak predictor for a shorter investment period but a strong predictor for a long investment period. The first plot shows 1-year investment periods and has a large “blob” of blue dots with poorly fitted return-curves. This means the P/Sales ratio is a weak predictor for the 1-year returns of the S&P 500.
This makes sense because in the short-term the P/Sales ratio only changes because of the share price as the sales-per-share is almost constant in the short-term. And it seems highly unlikely that we can predict future returns from the share-price alone.
The last plot shows 10-year investment periods where the curves fit the blue dots quite well, so the P/Sales ratio is a strong predictor for 10-year returns of the S&P 500.
We can forecast the 10-year annualized returns using the fitted “return curves” and formulas from the plots above.
Note that, we have not adjusted the plot for inflation or sales growth! Right now I have shown only S&P 500 stocks, but it is well established for some individual stocks also!
On daily basis, the stocks may vary and may or may not be predictable but on the long term, it follows the economy!
We have shown that there is a strong empirical relationship between the P/Sales ratio and the long-term returns of the S&P 500 stock-market index as well as some individual stocks. For short-term investment periods of only a few years or less, the P/Sales ratio was found to be a weak predictor for the stock returns.
The above graph shown had a lot of noise because we considered fixed investment periods of exactly 10 years, for example. So even though the P/Sales ratio was a strong predictor for the mispricing at the buy-time, it was impossible to predict the mispricing at the sell-time, because the stock market could be in a bubble or in a crash 10 years into the future, which would distort the estimated returns.
A simple solution, which is to consider the average returns for all investment periods between 7 and 15 years, and then make a scatter-plot of the mean returns versus the P/Sales ratio. This produces incredibly smooth curves for estimating the future long-term returns of the S&P 500 and some individual stocks.
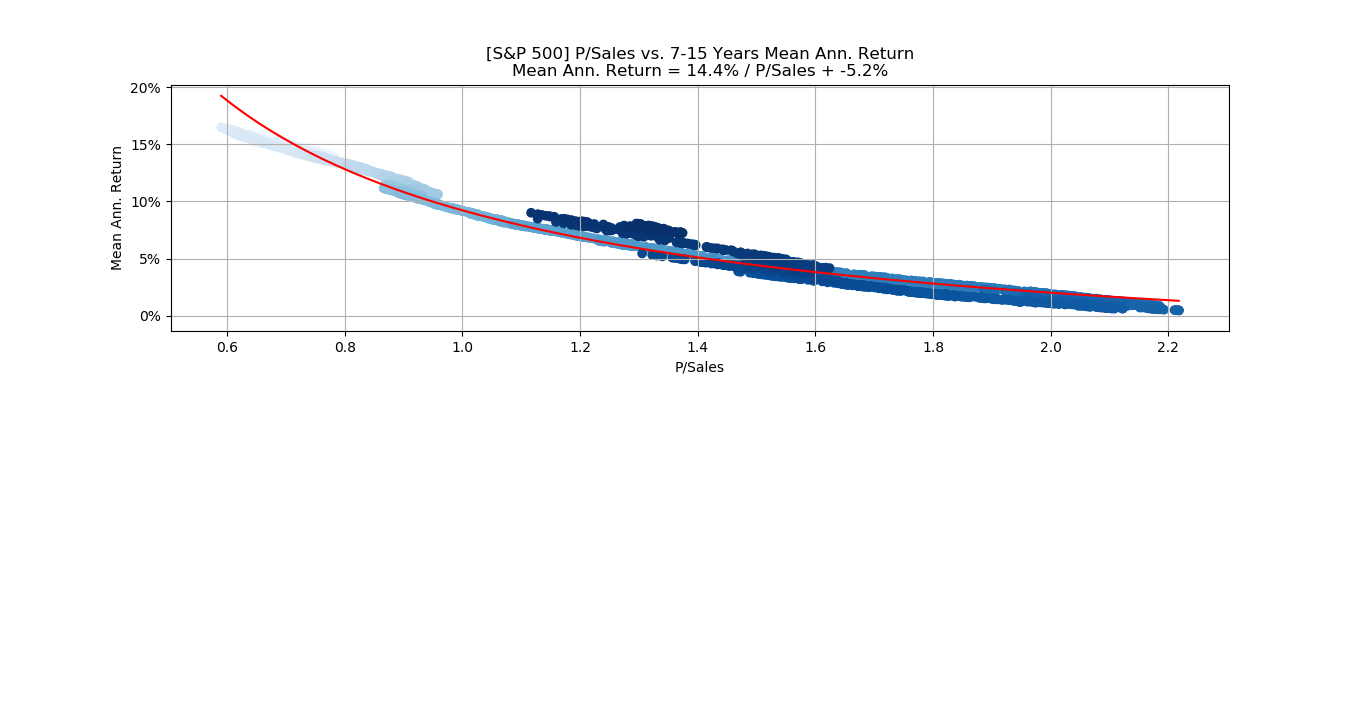
S&P 500
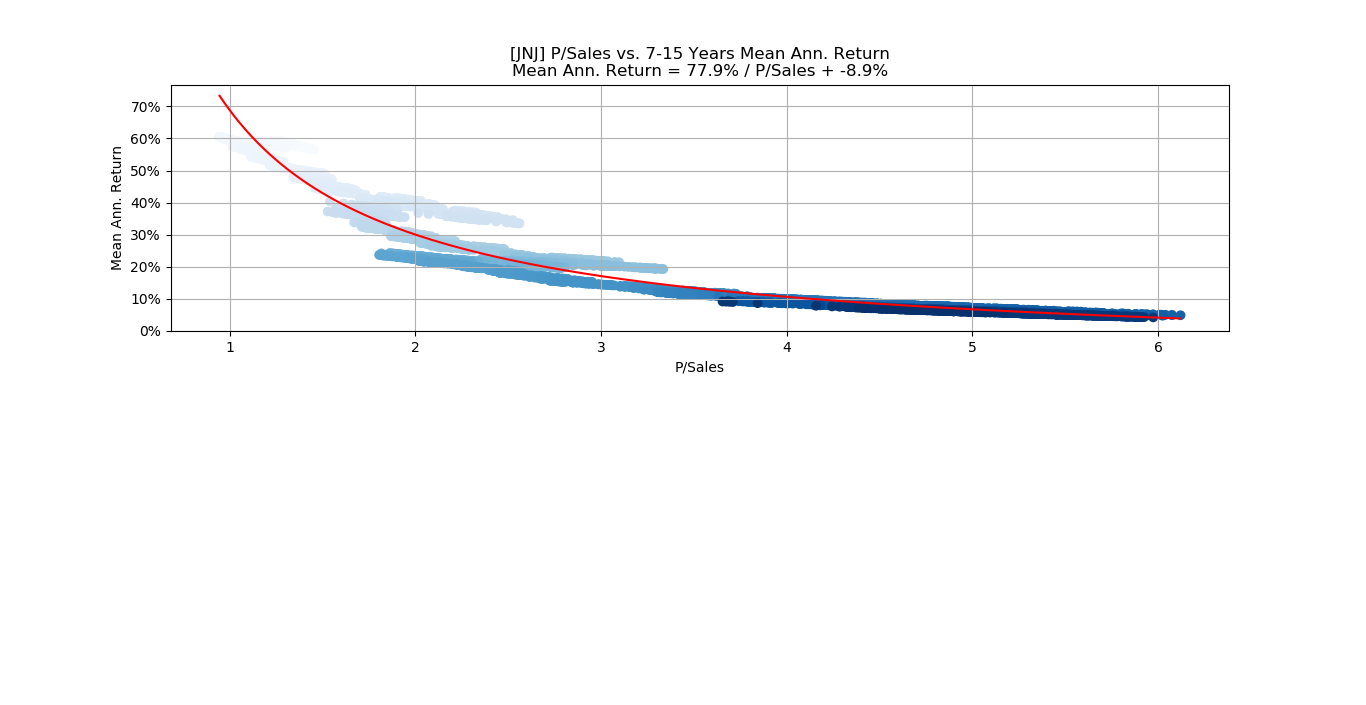
Johnson&Johnson
The blue shades in the scatter-plot indicate the time of the data-points and suggest that the separate curves belong to different periods of time. More research would be needed to establish why these periods have different “return curves”. Perhaps the periods had significantly different profit-margins or sales-growth.

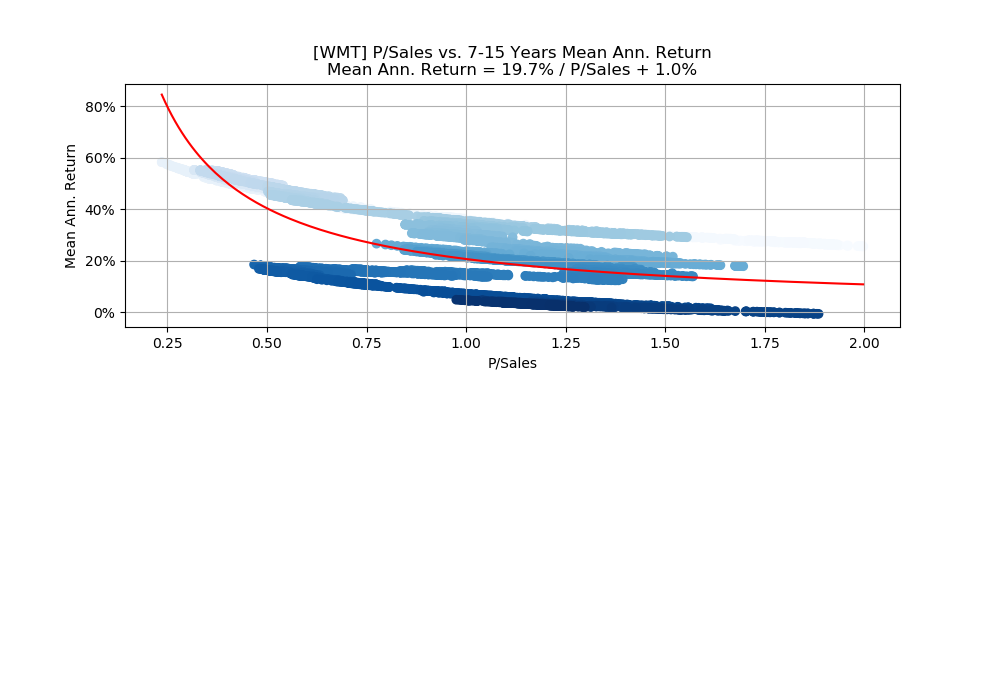
If we plot the P/Sales ratio versus the mean annualized return, we see that the red curve fits very poorly. There seems to be several separate trends in the data, and the blue shades indicate that the trends belong to different periods in time. But more research into the company’s financial history would be needed to uncover the reason for this, perhaps it is because of significantly different sales-growth, profit margins, etc.
We have shown that the P/Sales ratio is a very strong predictor for the long-term returns of the S&P 500 index and some individual stocks.
We considered fixed investment periods of e.g. 10 years, which meant that the investment return depended on the P/Sales ratio both at the time of buying and selling. This distorted the data because sometimes the stock-market would be in a bubble or crash 10 years later.
We presented a simple solution by considering all investment periods between 7 and 15 years, and then using the average return instead. This averages out the distorting effects of future bubbles and crashes, so we get much more smooth data that only depends on the P/Sales ratio at the buy-time.
We then fitted a reciprocal “return curve” to the scatter-plots, and although it generally had a very tight fit, it was not so accurate towards the end-points, thus suggesting that the reciprocal formula is not entirely correct for this data. It would be of great interest to not only find a mathematical model that fits better, but also a theoretical explanation of why that model makes sense.
It should be stressed that the forecasted returns will also depend on a qualitative assessment of the company. If the company’s future will be significantly different from its historical sales, profit margins, and growth, then the forecasted returns will be inaccurate. That is why this forecasting method is perhaps best used on broad stock-market indices such as the S&P 500, or companies whose products and markets are expected to be highly predictable long into the future